
Warning message
The subscription service is currently unavailable. Please try again later.The main results of the prospective and forecasting analysis will be collected in the PrimeDSS (Prime Decicion Support System) and PrimeDSF (Prime Decision Support Framework) .
A user-friendly web-based toolbox (the PrimeDSS) will collect and compile the researchs outputs for the final user. Fishermen, aquaculture producers, processing companies, market analysts, public authorities and other stakeholders will be able to browse the results and realise ad-hoc queries to implement PrimeFish results in their daily operations, anticipate the economic realm to take strategic and operative decisions. Specifically, the PrimeDSS will support them offering sound scientific advice on:
- Success and failure stories on product and practices innovation: what has worked and what hasn’t (labelling, new products, innovation, new packaging).
- Competitive position analyser: benchmarking of the economic performance against firms, sectors and national indicators.
- Value Chain Analyser: a set of case studies of how companies have persisted on the market with estimated scenarios.
- Growth risk analyser: an early warning system of potential boom and bust cycles through the analysis of the price composition, trends and other influential factors.
- Price development predictor: estimation of the best price for a product based on consumers’ willingness to pay for product attributes and target market place.
- Product success check: identification of the “best” match of consumer segments with seafood products according to the product’s characteristics.
Other results of PrimeFish will be included in a digital container called Prime Decision Support Framework (PrimeDSF), including:
- Method descriptions
- Models and its related assumptions
- Guidelines
- Recommendations
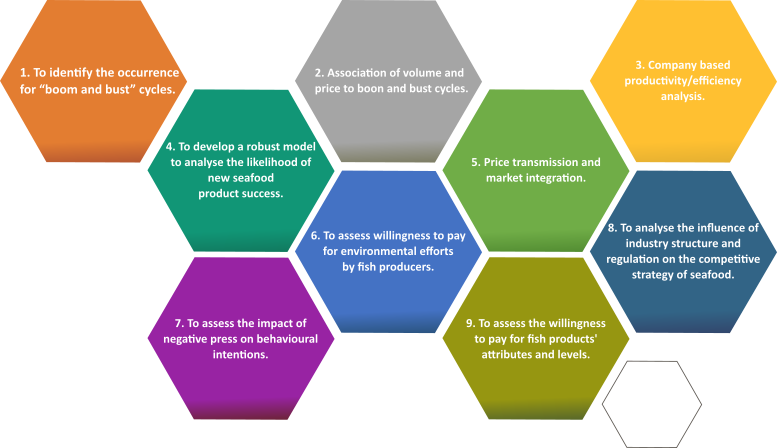
The following figure and table collect the models and analytics framework used for forecasting. However, the PrimeFish project (2015-2019) is at its mid-term stage, offering some preliminary results.
|
1. To identify the occurrence for “boom and bust” cycles for salmon, herring, cod, trout, seabass, seabream and pangasius |
|
|
Methodological approach |
The detection of “boom and bust” cycles in prices. Predictions of price are conducted implementing the Kalman Filters in MATLAB (doi: 10.1115/1.3662552), macroeconomic factors affecting boom and bust occurrence with regression analysis and the analysis of price transmission using cointegration models. |
|
Input data required |
Monthly prices for salmon, herring, cod, trout, seabass, seabream and pangasius at different stages of the chain (first sale, wholesale and retail, average annual prices for imported and exported products) for several years (according to the availability of data). Main source of data: monthly EUMOFA (Eurostat) trade data using first sale, wholesale, retail and export prices for Spain, UK, Denmark, Germany, Italy, Greece, Iceland, Norway, Faroe, Turkey, Canada and Vietnam. |
|
Output indicators/data |
Patterns in the price: time components i.e. year - trends, seasonality – months and other cyclical patterns. |
|
Potential scenarios |
The forecasting results include confidence bands that will help the user to understand the precision of the estimation. Users can decide the confidence level based on their risk aversion. |
|
Expected results |
- To predict price behaviour and give early warning signals of a potential "boom and bust" cycle. - To highlight the presence of eventual dumping phenomena and/or other infringements that affect the market competitiveness of the European fisheries and aquaculture sectors. |
|
2. Association of volume and price to boom and bust cycles |
|
|
Methodological approach |
Multiple regression analysis. |
|
Input data required |
Volume inputs from Kontali data and experts’ inputs for salmon, seabass and seabream. Monthly EUMOFA (Eurostat) trade data using first sale, wholesale, retail and export prices for Spain, UK, Denmark, Germany, Italy, Greece, Iceland, Norway, Faroe, Turkey, Canada and Vietnam. |
|
Output indicators/data |
Models for supply volumes, identification of impacts of supply and estimations on prices for demand balance. |
|
Potential scenarios |
Forecasting of supply and prices explanatory based. |
|
Expected results |
Salmon, seabass and seabream for forecasting of supply volumes and prices. |
|
3. Company based productivity/Efficiency analysis |
|
|
Methodological approach |
Frontier analysis (modelling) and data envelopment analysis for the estimation of production. |
|
Input data required |
Company accounting information (BVD info) and Kontali data. |
|
Output indicators/data |
Trends of efficiency and variation. Effects of potential determinants (e.g. investment or labor). |
|
Potential scenarios |
Efficiency expectation based on affecting and changing determinants |
|
Expected results |
Benchmarking of company efficiency and what-if scenario testing regarding the best productivity scenario. |
|
4. To develop a robust model to analyse the likelihood of new seafood product success |
|
|
Methodological approach |
A model, based on a logistic regression (Dayton and Macready, 1988; Hagenaars and McCutcheon, 2002), will match new seafood products with consumer segments, identified in advance through a latent class analysis (Lazarsfeld & Henry, 1968). The data collection method is a survey of around 4000 respondents. |
|
Input data required |
A European consumer online survey in 5 major European markets (Spain, France, Germany, Italy, United Kingdom) to find out their behaviour and attitude regarding seafood products. This survey is based on in-depth interviews, a literature review and studies on product successes and failures of the European industry, which were carried out previously. |
|
Output indicators/data |
-Various consumer segments with rich profiles in or across the markets (e.g. sociodemographic, benefit/usage, lifestyle variables and similar relevant to fish consumption and consumer behaviour). -Comparisons across countries and with other project outcomes (e.g. choice modelling) and extant studies. - Indication of fit between the product and the consumer segment. |
|
Potential scenarios |
The scenarios will be conditioned by the characteristic of the product launched. In particular; • The product attributes, • The firm information (e.g. communication and distribution activities)
|
|
Expected results |
The model will provide: - Consumer segments - The best match of consumer segment (demand) and product (offer) - An improvement of the product‘s attributes/and marketing variables - An accurate estimation of market size (i.e. segment) and its development |
|
5. Price transmission and market integration |
|
|
Methodological approach |
Granger causality model (ARMA-mixed), measuring the capacity of forecasting one time series with a different one. |
|
Input data required |
Eurostat and EUMOFA data. |
|
Output indicators/data |
Price relations in the value chain e.g. wholesale to retail. |
|
Potential scenarios |
Trends for price transmission in different steps of the value chain. |
|
Expected results |
Price transmission expectations for selected species and markets.
|
|
6. To assess willingness to pay for environmental efforts by fish producers |
|
|
Methodological approach |
The discrete choice models (Hanley and Barbier (2009) Pricing Nature) intents to forecast the choices made by seafood agents among a finite set of alternatives regarding non-market effects (e.g. escapes, overfishing). The data collection method is a survey. |
|
Input data required |
Fishermen and producers of cod and salmon provide specific data on their willingness to pay for avoiding non-market effects of their production activities. |
|
Output indicators/data |
Numeric estimates as measured in euro for the willingness to pay for various environmental efforts related to avoid detrimental environmental effects of the production. |
|
Potential scenarios |
Comparison among business as usual (BAU) and the adoption of the production process that includes the environmental efforts. |
|
Expected results |
A ranking of which environmental efforts fish producers are willing to implement, and which efforts they are not willing to implement |
|
7. To assess the impact of negative press on behavioural intentions |
|
|
Methodological approach |
This model allows estimating the impact of negative media information on behavioural intentions through attitudes and trust. It is based on the studies of Muller and Gaus in 2015, which is mainly based on Fishbein and Ajzen’s (2010) reasoned action model and Thøgersen’s (2000) model for predicting the purchase of labelled products. |
|
Input data required |
A survey of 4,000 respondents will focus on investigate the attitudes, credibility and behaviour of consumers regarding seafood. In particular, this study aggregates 800 representative responses per country studied; UK, Germany, France, Italy and Spain.
|
|
Output indicators/data |
-Estimates of consumers’ behavioural intentions regarding their fish consumption after reading the negative information. -Analysis of seafood consumer segments in relation to their profile, fish species and country. |
|
Potential scenarios |
Different behavioural intention depending on the proposed scenario:
Negative impact on: health vs environment. |
|
Expected results |
Evolution of the fish consumption impacted by the negative media information. |
|
8. To analyse the influence of industry structure and regulation on the competitive strategy of seafood businesses, including value chain position and certification schemes |
|
|
Methodological approach |
The analysis combines elements of Global Value Chain Analysis (Ponte 2010; Gereffi et al 2005) and analysis of competitive strategy (Porter 2000). The effects of industry consolidation measured by Herfindahl-Hirschmann index HHI) on strategic positioning at the business unit level will be central to the analysis. |
|
Input data required |
Interviews with company management staff; key informant interviews; secondary data on the input-output structure of supply chain (e.g. production volume, prices, landings, import and exports, wholesale…). |
|
Output indicators/data |
Case studies of successful companies structured along a pre-defined framework of analysis, including sectoral analysis (market trends, consolidation level, factors of production) and business unit level analysis (incl. marketing strategy, relationship with suppliers and buyers, value chain positioning) |
|
Potential scenarios |
The case studies, around 35, will exemplify the results of innovative strategic decisions, including those related to positioning along the value chain. The scenarios analysed are conditioned by the environment where the firms operate. The main outcomes are thus context-specific strategic positioning practices. |
|
Expected results |
The target audience is SMEs along the seafood value chain. The case studies will allow companies to discover potential strategic positioning routes relevant to their context and will provide an analytical framework to assess a vertical/horizontal integration along value chain among other strategic options |
|
9. To assess the willingness to pay for fish products’ attributes and levels |
|
|
Methodological approach |
Discrete labelled choice experiment for outlining consumers’ preferences (Boxall & Adamowicz, 2002; Kamakura & Russell, 1993; Nguyen et al., 2015; Wedel & Kamakura, 2000). |
|
Input data required |
An online survey in 5 European markets (Spain, France, Germany, Italy, United Kingdom). |
|
Output indicators/data |
Part-worth (utilities) and willingness to pay (WTP) of fish products’ attributes and levels. |
|
Potential scenarios |
Willingness to pay (€/kg) for product profiles with selected attributes and levels. |
|
Expected results |
Evaluation of fish attributes (e.g., farmed vs. wild catch, health claims, etc.). Comparation between different product and species. Evaluation of different preferences and WTP among countries. |